
What if there was a calculation to help you identify which listings would be a waste of your time? What if that calculation could also guide your conversations with sellers about how long of a listing agreement makes sense? And what if you could share the results of that calculation with buyers and sellers to help them understand why the price they have in mind may not help them get an accepted offer or sell the home?
This calculation, which provides insights into real estate supply and demand, is one you’ve likely heard mentioned frequently. It’s called months of inventory, and it’s not just for economists.
How you can use months of inventory
You may be used to seeing months of inventory reported for your MLS, your city, or even the entire state. While interesting, you probably can’t effectively use that information. After all, real estate is local.
But you can figure out the months of inventory for a ZIP code, a market area, a geographic farm, a neighborhood, a price range, a type of property, or any other market criteria you define.
Once armed with the months-of-inventory number, you will have an excellent indicator of whether that area, property type, or price range is currently in a buyer’s market, a seller’s market, or a balanced market.
That information, combined with other data, provides context you can use for more productive real estate discussions with prospects and clients.
What does months of inventory tell you?
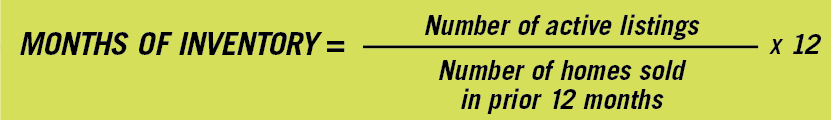
Months of inventory calculates how long it would take for all homes currently on the market to sell if sales continue at the pace they have averaged over the last 12 months. The calculation assumes that no new homes come on the market.
The formula
You may be able to calculate months of inventory for a market segment through your MLS or another program or app. If not, figuring out months of inventory on your own is not complicated.
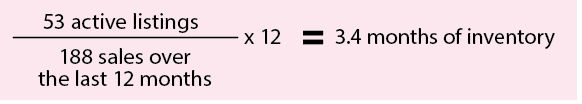
For example, if there are 53 homes currently for sale and 188 homes sold over the last 12 months, the calculation looks like this:
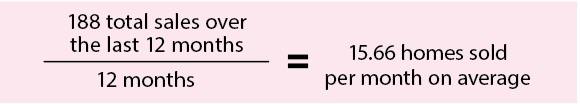
You may find it easier to understand months of inventory by breaking the calculations into two steps:
1. Figure out the average number of sales per month over the last 12 months. Using the numbers from the example above:
2. Calculate months of inventory by dividing the total number of active listings by the average number of
homes sold per month.
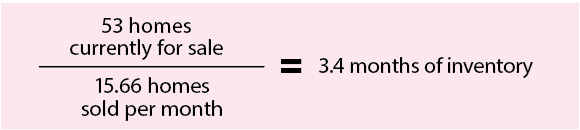
No matter which method you use to calculate months of inventory, what it tells you in this example is that it would take 3.4 months to sell the 53 homes currently on the market if sales continue at the same rate that they averaged over the past 12 months.
Figuring months of inventory for other time periods
It is common to figure out months of inventory based on average monthly sales for the past year, because that takes seasonal sales fluctuations into account. But you can figure out months of inventory based on other time periods. You might choose to use a shorter time frame if there were significant changes in the market less than 12 months ago—perhaps a natural disaster or a new development starting to sell homes nearby.
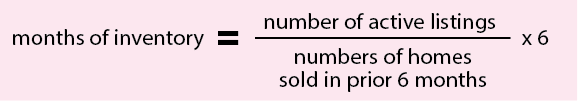
To base the formula on average sales over the last six months, for example, you would adjust the formula as follows:
What’s the mark of a buyer’s or seller’s market?
According to the experts at the Real Estate Center at Texas A&M University, six to six-and-a-half months of inventory indicates a balanced market. Numbers lower than six months represent a seller’s market, while numbers higher than six-and-a-half months signify a buyer’s market. The further away from six months the months-of-inventory number is, the more pronounced that buyer’s or seller’s market is likely to be.
I did the math … now what?
Months of inventory across Texas
Although months of inventory may be most helpful when figured for smaller market segments, the statistic provides insights for supply and demand across the state in metropolitan statistical areas.
Here are months of inventory numbers reported in the association’s 2017 Real Estate Year in Review report.
Texas: 3.1 months of inventory
Markets with lowest months of inventory
Midland 1.4
Dallas-Fort Worth-Arlington 1.9
Austin-Round Rock 2.1
Markets with the highest months of inventory
Texarkana 16.9
McAllen-Edinburg-Mission 8.7
Longview 6.8
Knowing the months of inventory—along with other market information—can help you negotiate with sellers about taking listings. Suppose you’re meeting with a prospect whose home is worth $415,000 based on comps and other information you’ve gathered. The seller is adamant about asking $450,000.
You have figured months of inventory in that neighborhood for homes between $400,000 and $475,000 is 15 months, but the seller tells you about a friend across town who sold her home in a week for full asking price. It turns out that friend’s home is not only in a different geographical area but also a much lower price range.
When you do the calculations for the friend’s neighborhood and price range, you learn the months of inventory is only 2.5 months. If you explain how the market for the seller’s home is vastly different for the market for the friend’s home, and the seller still won’t budge from his ambitious asking price, you might decide you don’t want that listing
On the other hand, consider the same seller who wants to ask $450,000 for a home worth $415,000 based on comps. In this scenario, though, you learn there is 1.9 months of inventory for four-bedroom, three-bath homes like the seller’s in that neighborhood and price range. You can still have a conversation about asking price with that prospect, but you may be more willing to spend your time on that listing.
Knowing the months of inventory for a market segment can influence your discussions and decisions about the length of listing agreement you are willing to sign. The higher the months of inventory, the less likely a short listing agreement will be sufficient.
When working with buyers, discussing the months of inventory along with data like days on market can help you explain how quickly decisions need to be made. The statistic also may help your buyers understand whether certain types of offers stand a good chance of acceptance.
There are many numbers you can analyze to help you and your clients’ better understand the real estate market. Months of inventory provides a key measure of supply and demand you can use to make smarter, better-informed decisions.